Acimall Outlook: industry numbers
Again this year, the Acimall Studies Office has published the 2023 statistics of the industry’s most significant companies. A traditional overview, much appreciated by our readers.
According to tradition, the Acimall Studies Office has laid down for Xylon the ranking of the financial results of wood-related industries in Italy, including “Woodworking technology and more”, “Production of wooden furniture”, “Production of wood-based panels and semifinished materials”, “Production of wooden doors and windows”, “Wooden houses and elements for the construction industry” and “Wood and furniture trade”. The ranking has been drafted based on the balance sheets available so far, related to 2023.
WOODWORKING TECHNOLOGY
The analysis is normally focused on woodworking technology, highlighting their trend compared to previous years, while the rankings for the wood-furniture industry provide an all-round view of the entire industry.
The analysis – summed up in the table on page 17 – takes into consideration the top 50 Italian companies (Ateco code 2007) in terms of sales revenues in 2023. The ranking also includes companies with mixed production, where you cannot separate the revenue share associated to wood technology, based on the financial data we have.
Scm Group from Rimini, Biesse from Pesaro, and Cefla from Imola take the top-three positions. For the sake of correct information, we point out that the third-ranked company’s core business is not woodworking technology.
The 50 companies listed in the ranking have total revenues above 3.553 billion euro, versus 3.415 in 2022, with an average value of 71 million per company (it was 68 in 2022). As you can see in chart 1, the revenue level of the 50th company, i.e. the first one above the “entry level” of our ranking, has increased further for the third year in a row. One of the key elements emerging from the historical trend of this variable is that, also in 2023 just like in 2022, the value is higher than in 2008, the year before the financial crisis that struck all the global markets and forced companies to revolutionize their organization models.
The median value, equal to 16.6 million euro, is higher than in 2022 (13.8 million). Also the gross margins are higher than in 2022, on average: the average Ebitda value stands at 7.7 million euros versus 7.5 in 2022.
Chart 2 shows a comparison between the results of the past two years, in terms of percent variation of revenues, for the fifty companies under scrutiny. In detail, one half of the sample – located in the top right quadrant – have grown for two consecutive years. they had already grown in 2022 and improved their results also in 2023; one quarter of companies (24 percent), located in the bottom right quadrant, suffered from a shrinkage of business after growing in 2022; only four companies have recovered after falling in 2022 (top left), while only three companies in the sample recorded negative results for two consecutive years (bottom left).
Finally, the industry’s average Ebitda margin (related to turnover) moved from 9.7 to 10.8 percent, recording an increase by more than one percent, while the average value of net revenues recorded a smaller increase (from 4.9 to 5.4 percent). Shifting the focus to each company, one third recorded lower gross margins in 2023 compared to 2022; this share is higher (approximately two-thirds of companies) if you look at the trend of net revenues.
2023 AND THE CURRENT ECONOMIC SITUATION
Compared to 2022, we remind you that the value of production, gross of inflation, reached an all-time high of 2.646 billion euros, with 1.808 billion export and record sales on the domestic market for 838 million euros. Italy’s apparent consumption went far beyond 1.100 billion euro, reaffirming the country’s fourth place in the global ranking. Looking at 2023, there was a slight growth (plus 0.1 percent versus 2022) of production, equal to 2.650 billion euro, 1.845 billion of which came from the foreign markets (up by 2.0 percent) and 805 million euro from sales on the domestic market (down by 0.4 percent compared to one year before). The industry was characterized by a growth of import figures by 6.3 percent. As to 2024, preliminary balance figures suggest that the industry is recording a reduction of all major indexes: production (down 8.3 percent), domestic market sales (down 9.5 percent) and global sales (down 7.8 percent).
THE METHOD
The figures used in the rankings are taken from the Aida-Bureau Van Dijk database, which includes all the budgetary data of Italian companies.
The production activity of companies has been identified from the corresponding Ateco 2007 code.
Some companies have been included in a different business category, other than the activity specified in the balance sheet, based on patent and objective observation. We have also considered non-consolidated balance figures, with the exception of companies marked with an asterisk. The calculation criteria are the following: Turnover variation: it is the percent variation of sales revenues compared to the previous year. Ebitda: it is a revenue margin that defines the earnings of a company before interest, taxes, depreciation, extraordinary components and amortization. Net profits: in the official balance sheet of a company, this value indicates the income of a company, net of costs and taxes. Production value: it is the sum of net revenues, stock-in-trade variations and other entries.
by Acimall Studies Office
Table 1 – TOP-50 COMPANIES IN “WOODWORKING MACHINE TOOLS”
| Ranking | Company | 2023 Sales Revenues (000 €) | 2023/2022 Revenue Variation (%) | 2023 Headcount | 2023 Production Value (000 €) | 2023 Ebitda (000 €) | 2023 Net Pofits (000€) |
| 1 | SCM GROUP S.P.A.* | 914,078 | 8.0 | 4,254 | 969,154 | 97,456 | 41,438 |
| 2 | BIESSE S.P.A.* | 785,002 | -4.6 | n.d. | 758,510 | 59,017 | 12,483 |
| 3 | CEFLA S.C.* | 684,923 | 5.8 | 1,756 | 690,466 | 93,372 | 66,150 |
| 4 | FREUD S.P.A. | 149,985 | -13.8 | 660 | 151,675 | 21,291 | 7,835 |
| 5 | PAL S.P.A. | 107,556 | 31.9 | n.d. | 110,410 | 11,339 | 7,023 |
| 6 | CASSIOLI* | 81,631 | 12.6 | n.d. | 99,164 | 14,761 | 9,459 |
| 7 | IMAL srl | 74,441 | -30.7 | 232 | 86,219 | 5,589 | 844 |
| 8 | COSTA LEVIGATRICI S.P.A. | 48,966 | 13.7 | 196 | 50,383 | 6,771 | 4,359 |
| 9 | PAOLINO BACCI S.R.L. | 43,289 | 0.0 | 82 | 43,978 | 7,494 | 5,118 |
| 10 | PEZZOLATO S.P.A. | 34,686 | 22.5 | 123 | 35,947 | 4,926 | 2,922 |
| 11 | STORTI S.P.A. | 33,880 | 31.4 | 141 | 34,773 | 3,187 | 1,808 |
| 12 | WORKING PROCESS S.R.L. | 28,192 | 27.4 | 78 | 28,522 | 2,468 | 1,267 |
| 13 | UNICONFORT S.R.L. | 27,783 | 22.4 | 61 | 32,936 | 1,096 | 407 |
| 14 | MASTERWOOD S.P.A. | 24,865 | -12.2 | 96 | 24,236 | 1,226 | 640 |
| 15 | MAKOR S.R.L. | 23,932 | -10.2 | 100 | 24,353 | 2,649 | 1,652 |
| 16 | CORAL S.P.A. | 23,846 | 17.5 | 115 | 25,142 | 2,828 | 842 |
| 17 | ESSETRE S.R.L. | 23,227 | 9.9 | 55 | 24,952 | 4,393 | 2,765 |
| 18 | SIRIO S.R.L. | 22,087 | 111.0 | 35 | 20,991 | 7,308 | 5,333 |
| 19 | ORMAMACCHINE S.P.A. | 22,041 | 14.4 | 98 | 21,950 | 377 | 98 |
| 20 | CORALI S.P.A. | 20,050 | 4.3 | 67 | 20,761 | 3,600 | 2,812 |
Table 2 – TOP-10 COMPANIES IN “WOODEN FURNITURE PRODUCTION”
| Ranking | Company | 2023 Sales Revenues (000 €) | 2023/2022 Revenue Variation (%) | 2023 Headcount | 2023 Production Value (000 €) | 2023 Ebitda (000 €) | 2023 Net Pofits (000€) |
| 1 | FRIUL INTAGLI spa | 865,764 | -7.7 | 2,119 | 867,045 | 141,157 | 78,721 |
| 2 | MOLTENI & C. S.P.A. | 318,989 | 4.8 | 682 | 321,723 | 29,925 | 12,533 |
| 3 | VENETA CUCINE S.P.A. | 281,846 | 6.9 | 530 | 304,051 | 27,36 | 14,249 |
| 4 | LUBE INDUSTRIES S.R.L. | 274,343 | 1.8 | 514 | 282,812 | 30,357 | 19,063 |
| 5 | NATUZZI S.P.A. | 268,089 | -33.8 | 1,916 | 270,413 | -3,419 | -16,175 |
| 6 | POLIFORM S.P.A. | 255,259 | 8.7 | 706 | 258,828 | 45,969 | 25,445 |
| 7 | ARREDO 3 S.R.L. | 236,186 | -1.0 | 303 | 237,226 | 21,764 | 13,607 |
| 8 | MINOTTI S.P.A. | 220,428 | -2.5 | 239 | 221,134 | 68,179 | 57,742 |
| 9 | POLTRONA FRAU S.P.A. | 219,024 | 8.4 | 673 | 243,382 | 38,586 | 27,187 |
| 10 | SCAVOLINI S.P.A. | 206,892 | -9.7 | 602 | 213,9 | 14,553 | 7,277 |
Table 3 – TOP-10 COMPANIES IN “PRODUCTION OF WOOD-BASED PANELS AND MATERIALS”
| Ranking | Company | 2023 Sales Revenues (000 €) | 2023/2022 Revenue Variation (%) | 2023 Headcount | 2023 Production Value (000 €) | 2023 Ebitda (000 €) | 2023 Net Pofits (000€) |
| 1 | MEDIA PROFILI S.R.L. | 381,170 | -3.7 | 1,063 | 384,703 | 19,985 | 3,039 |
| 2 | GRUPPO MAURO SAVIOLA S.R.L. | 335,624 | -16.9 | 671 | 350,371 | 60,757 | 37,176 |
| 3 | FANTONI S.P.A. | 294,653 | -25.2 | 598 | 317,668 | 50,149 | 17,706 |
| 4 | FRATE LUIGI S.P.A. | 203,156 | -29.0 | 327 | 220,252 | 53,937 | 52,194 |
| 5 | S.A.I.B. S.P.A. | 62,006 | -65.4 | 249 | 65,675 | 10,007 | 5,256 |
| 6 | CLEAF S.P.A. | 145,754 | -19.7 | 294 | 146,646 | 15,754 | 7,919 |
| 7 | KRONOSPAN ITALIA S.P.A. | 115,096 | -10.2 | 79 | 118,019 | 5,649 | 1,187 |
| 8 | PANGUANETA S.P.A. | 104,545 | -3.3 | 203 | 105,368 | 23,898 | 14,444 |
| 9 | KASTAMONU ITALIA S.P.A. | 99,906 | -12.2 | 275 | 104,888 | 22,280 | 3,883 |
| 10 | BIPAN S.P.A. | 98,593 | -42.9 | 215 | 105,719 | 5,514 | -1,929 |
Table 4 – TOP-10 COMPANIES IN “PRODUCTION OF WOODEN DOORS AND WINDOWS”
| Ranking | Company | 2023 Sales Revenues (000 €) | 2023/2022 Revenue Variation (%) | 2023 Headcount | 2023 Production Value (000 €) | 2023 Ebitda (000 €) | 2023 Net Pofits (000€) |
| 1 | COCIF S.C. | 67,328 | 29.7 | 215 | 65,395 | 9,637 | 48 |
| 2 | BERTOLOTTO S.P.A. | 55,138 | 1.0 | 180 | 56,019 | 10,039 | 3,404 |
| 3 | WOLF FENSTER S.P.A. | 45,006 | 7.5 | 182 | 45,026 | 8,790 | 5,333 |
| 4 | GAROFOLI S.P.A. | 41,312 | -6.4 | 220 | 43,635 | 4,377 | 2,718 |
| 5 | ZANINI S.P.A. | 35,543 | -4.1 | 59 | 37,404 | 2,033 | 700 |
| 6 | PALAGINA S.R.L. | 33,559 | 2.3 | 200 | 34,885 | 4,617 | 2,815 |
| 7 | ITALIAN WINDOW DISTRIBUTION &TRADING S.R.L. | 33,060 | 36.9 | 86 | 30,381 | 8,084 | 4,812 |
| 8 | EFFEBIQUATTRO S.P.A. | 30,536 | 0.2 | 80 | 31,995 | 1,933 | 377 |
| 9 | RUBNER TUEREN S.R.L. | 30,110 | -3.9 | 184 | 31,622 | 6,425 | 4,404 |
| 10 | SILVELOX GROUP S.P.A. | 28,537 | 6.8 | 118 | 30,307 | 2,844 | 321 |
Table 5 – TOP-10 COMPANIES IN “HOUSES AND TIMBER COMPONENTS FOR CONSTRUCTIONS”
| Ranking | Company | 2023 Sales Revenues (000 €) | 2023/2022 Revenue Variation (%) | 2023 Headcount | 2023 Production Value (000 €) | 2023 Ebitda (000 €) | 2023 Net Pofits (000€) | |
| 1 | BRAGA S.P.A. | 104,546 | 107,649 | -2.9 | 255 | 107,467 | 15,846 | 7,783 |
| 2 | RUBNER HAUS S.R.L. | 56,503 | 53,641 | 5.3 | 216 | 65,471 | -759 | -1,984 |
| 3 | DELLA CAMERA ARREDAMENTI S.R.L. | 36,366 | 32,050 | 13.5 | 84 | 37,534 | 5,248 | 3,245 |
| 4 | BIO HABITAT S.P.A | 34,958 | 30,317 | 15.3 | 93 | 40,453 | 4,144 | 2,804 |
| 5 | RUBNER HOLZBAU S.R.L. | 33,812 | 46,645 | -27.5 | 144 | 43,66 | 1,586 | 196 |
| 6 | CHENEVIER S.P.A. | 26,956 | 11,260 | 139.4 | 40 | 23,951 | 5,218 | 3,482 |
| 7 | KARL PEDROSS S.P.A. | 25,016 | 24,191 | 3.4 | 175 | 25,502 | 1,898 | 23,523 |
| 8 | I.L.M.A. S.R.L. | 20,069 | 10,059 | 99.5 | 39 | 20,05 | 3,754 | 1,387 |
| 9 | STAIRS STUDIO S.P.A. | 18,138 | 14,453 | 25.5 | 65 | 18,334 | 1,403 | 755 |
| 10 | ITLAS S.R.L. | 16,825 | 17,745 | -5.2 | 38 | 18,393 | 1,843 | 934 |
Table 6 – TOP-10 COMPANIES IN “WOOD AND FURNITURE TRADE”
| Ranking | Company | 2023 Sales Revenues (000 €) | 2023/2022 Revenue Variation (%) | 2023 Headcount | 2023 Production Value (000 €) | 2023 Ebitda (000 €) | 2023 Net Pofits (000€) |
| 1 | CORA’ DOMENICO E FIGLI S.P.A. | 97,544 | -22.7 | 83 | 98,85 | 4,448 | -11,492 |
| 2 | FLORIAN LEGNO S.P.A. | 68,972 | -13.4 | 68 | 70,494 | 6,157 | 2,335 |
| 3 | L.E.S. S.R.L. | 68,478 | 7.7 | 8 | 69,455 | 6,011 | 4,286 |
| 4 | SANGIORGI LEGNAMI S.P.A. | 52,864 | -29.0 | 30 | 47,981 | 10,155 | 6,087 |
| 5 | BONOMI PATTINI S.P.A. | 45,234 | -12.8 | 48 | 45,844 | 4,511 | 3,02 |
| 6 | KIMONO S.P.A. | 43,048 | -3.5 | 33 | 43,205 | 1,868 | 374 |
| 7 | BUFFOLI LEGNAMI S.R.L. | 41,022 | -6.3 | 12 | 41,147 | 2,566 | 1,36 |
| 8 | IMOLA LEGNO S.P.A. | 40,848 | -25.0 | 98 | 42,554 | 1,604 | -279 |
| 9 | KARL PICHLER S.P.A. | 40,608 | -4.3 | 69 | 41,596 | 6,345 | 3,628 |
| 10 | LP GROUP S.R.L. | 35,307 | -27.3 | 12 | 38,205 | 3,875 | 2,317 |
Read also...

Mmfa: a 2025 exceeding 100 million square metres
The new “Wallteq M-300” by Weinmann
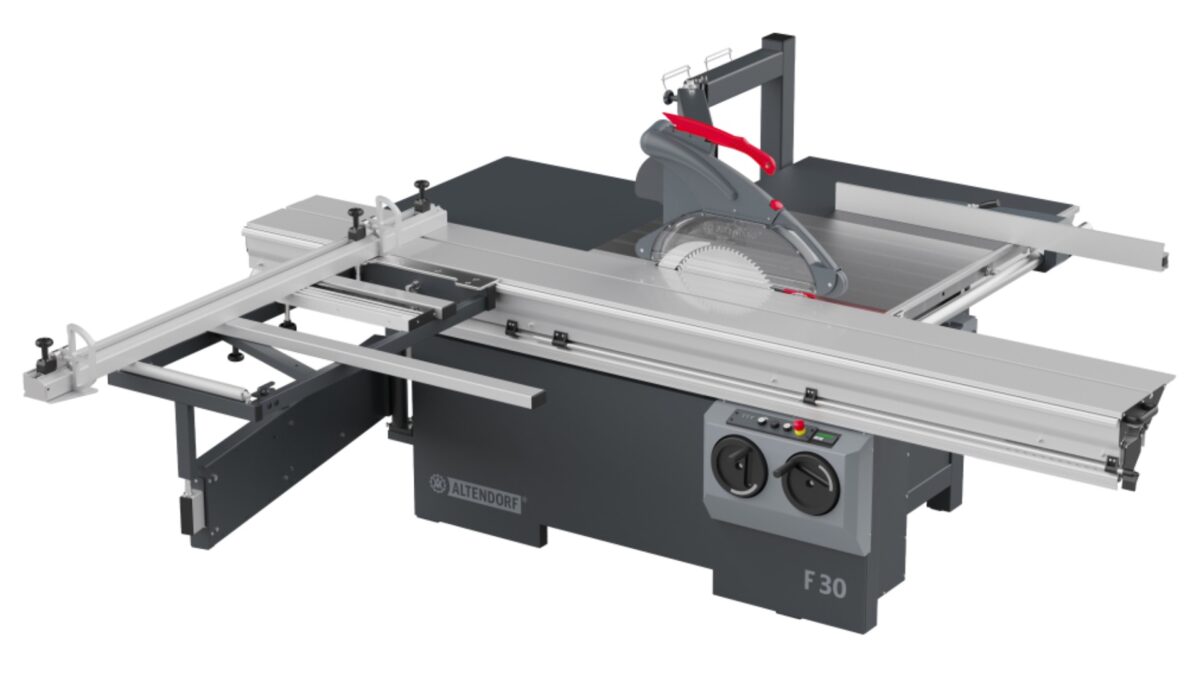
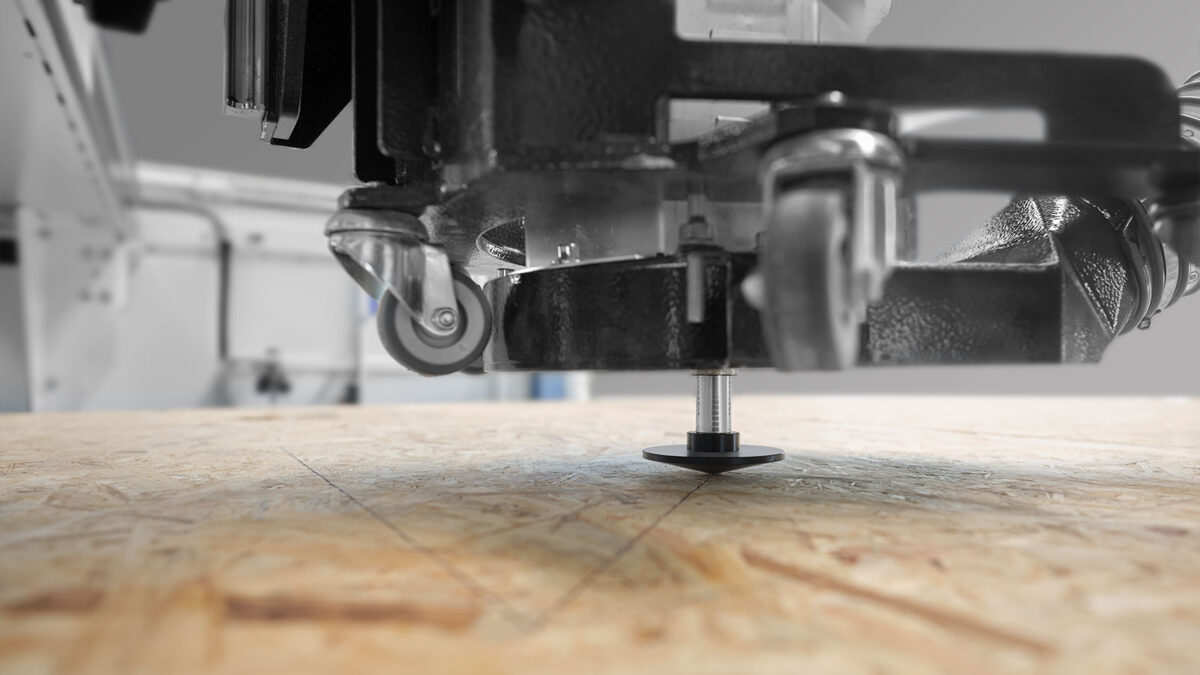
Altendorf introduces new F 30 sliding table saw for the craft segment
“Ecobox” and “Osb Flammex”: Egger’s new solutions
Over 300 attendees in Lazise: Holzbau Forum Italia and the future of timber construction