Acimall Outlook
This year again, Acimall’s Research Department, in collaboration with Value Quest, has compiled its ranking of the economic performance of the wood supply chain in Italy, monitoring the entire value chain: from production technologies to finished products, all the way to their commercialization.
The sectors analyzed, based on the available 2024 financial statements, are “Woodworking machinery and tools,” “Production of wood-based panels and semi-finished products,” “Production of wooden windows and doors,” “Wooden houses and building components,” and “Wood and furniture: commercialization.”
THE MACROECONOMIC CONTEXT
2024 unfolded within a macroeconomic context marked by moderate growth not only at the national level but also across Europe. The slowdown in industrial investment, less expansionary monetary policies than in the past, and an uncertain international environment were the main factors contributing to this macroeconomic scenario, which was characterized by greater caution than in previous years.
Overall, the data for the companies selected within the sectors considered showed a significant ability to adapt: the total revenue of the companies included in the sector rankings exceeded €11.5 billion, showing a 2 percent contraction compared with 2023, a figure that reflects a natural adjustment after the excellent results recorded in the previous two-year period.
WOODWORKING TECHNOLOGIES
The main focus of the analysis concerns the top fifty companies in the “Woodworking machinery and tools” sector by turnover. As usual, the study is complemented by the “Top 20” data for the other segments, thus ensuring an overall view of the entire supply chain.
Within this macro-sector, the fifty companies in the woodworking machinery and tools ranking represent a primary component, with 2024 revenue totaling around €3.47 billion, confirming their role as one of the main pillars of the industrial system analyzed. It should be noted that the ranking also includes companies with diversified offerings across multiple business lines: for such companies, based on publicly available financial statement data, it is not possible to determine the share of revenue generated exclusively by the segment under analysis, so these companies were considered on the basis of their total consolidated revenue.
Once again this year, although posting a decline in revenue in line with that of the sector as a whole, the largest companies were SCM Group of Rimini, Biesse of Pesaro, and Cefla of Imola, all of which maintain undisputed global leadership. For the latter, however, the development of woodworking technologies is not its predominant business.
From the standpoint of profitability, the sector shows an excellent ability to preserve operating margins, especially in a market that is less expansionary than in the past and marked by greater uncertainty, like the current one. Aggregate EBITDA (earnings before interest, taxes, depreciation, and amortization), amounting to around €382 million, despite an ongoing effort to contain costs and improve production efficiency, combined with lower revenue, effectively caused a deterioration in the average EBITDA margin (EBITDA/revenue), which fell from 11.3 percent in 2023 to 10.5 percent in 2024.
In 2024, average revenue per company was €69 million, down from €73 million in the previous year. Despite this decrease, the sector shows no signs of reversing the business size consolidation process that began in previous years.
A further in-depth analysis of size clusters, which is beyond the scope of this study, could provide more specific indications.
Another significant figure concerns human capital: the fifty leading technology companies employ about 14,500 people. The preservation of employment levels, despite the temporary contraction in production, suggests that companies regard technical skills and know-how as strategic assets to be safeguarded in order to seize future potential growth phases.
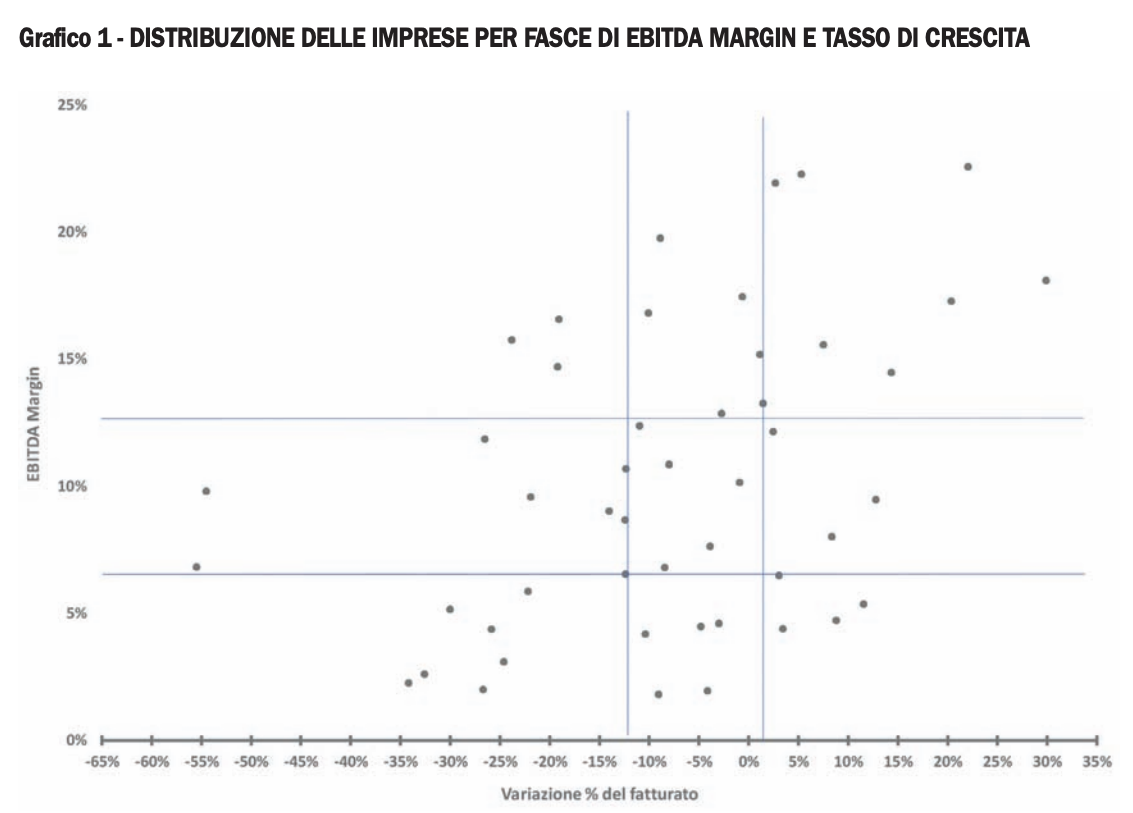
Chart 1 compares the growth of the fifty most significant companies in the sector with their EBITDA margin (EBITDA/Revenue). To analyze more effectively the relationship between growth and operating profitability, we divided the companies into three groups based on EBITDA margin (high-margin, medium-margin, and low-margin companies) and relative growth (high-growth, medium-growth, and low-relative-growth companies).
The analysis of the chart shows that the most successful companies (high margin-high growth), as well as those with less favorable performance (low margin-low growth), are proportionally more numerous than those that “cross” the characteristics (high margin-low growth and low margin-high growth). The statistical interpretation of this evidence suggests the existence of a virtuous circle between high margins and high growth, as well as of a vicious circle between low margins and low growth.
BEYOND THE BUSINESS CYCLE: LONG-TERM DYNAMICS
By extending the analysis of the sector’s fifty companies from the last two years to a broader time horizon (ten years), a number of structural trends emerge with particular clarity, trends that have progressively redefined the market’s competitive dynamics. Long-term observation makes it possible to move beyond short-term cyclical volatility and identify the deeper phenomena that have affected the configuration of supply, the competitive structure, and the profitability levels of the companies analyzed.
From this perspective, the sector’s evolution can be traced back to three closely interconnected dynamics: demand growth and the expansion of the overall market; the progressive increase in company size through consolidation; and the recovery in operating profitability.
These phenomena did not occur in isolation, but rather acted synergistically, reinforcing one another and helping define a path of structural transformation for the sector.
MARKET GROWTH AND DEMAND DEVELOPMENT
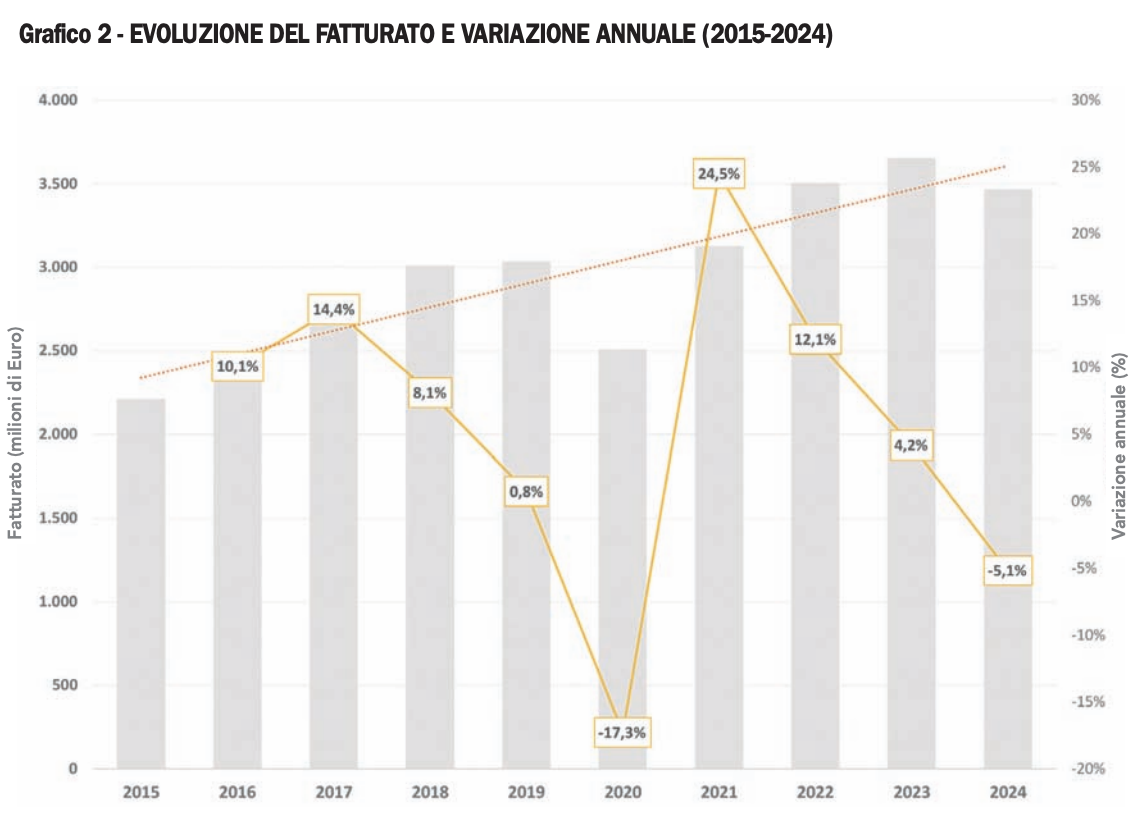
The first structural element is the steady growth recorded by the sector since 2015 (Chart 2). Over the decade under consideration, the sample’s aggregate revenue increased by a total of 56 percent, corresponding to a compound annual growth rate (CAGR) of 4.6 percent. This is a significant trend when compared with the average performance of the Italian economy over the same period, which was marked by alternating phases and much more limited overall growth. The sector’s ability to maintain an expansionary trajectory over the long term suggests the presence of structural growth drivers, such as evolving customer needs, the expansion of target markets, and increasing specialization of supply.
The 56 percent growth over ten years also indicates the sector’s ability to capture new opportunities, either by expanding its customer base or by increasing the average value of its supplies. In competitive terms, this resulted in an expansion of available market space, partly reducing the competitive pressure typical of stagnant environments and allowing a significant number of companies to grow without necessarily resorting to aggressive pricing strategies.
SIZE CONSOLIDATION AND COMPETITIVE POLARIZATION
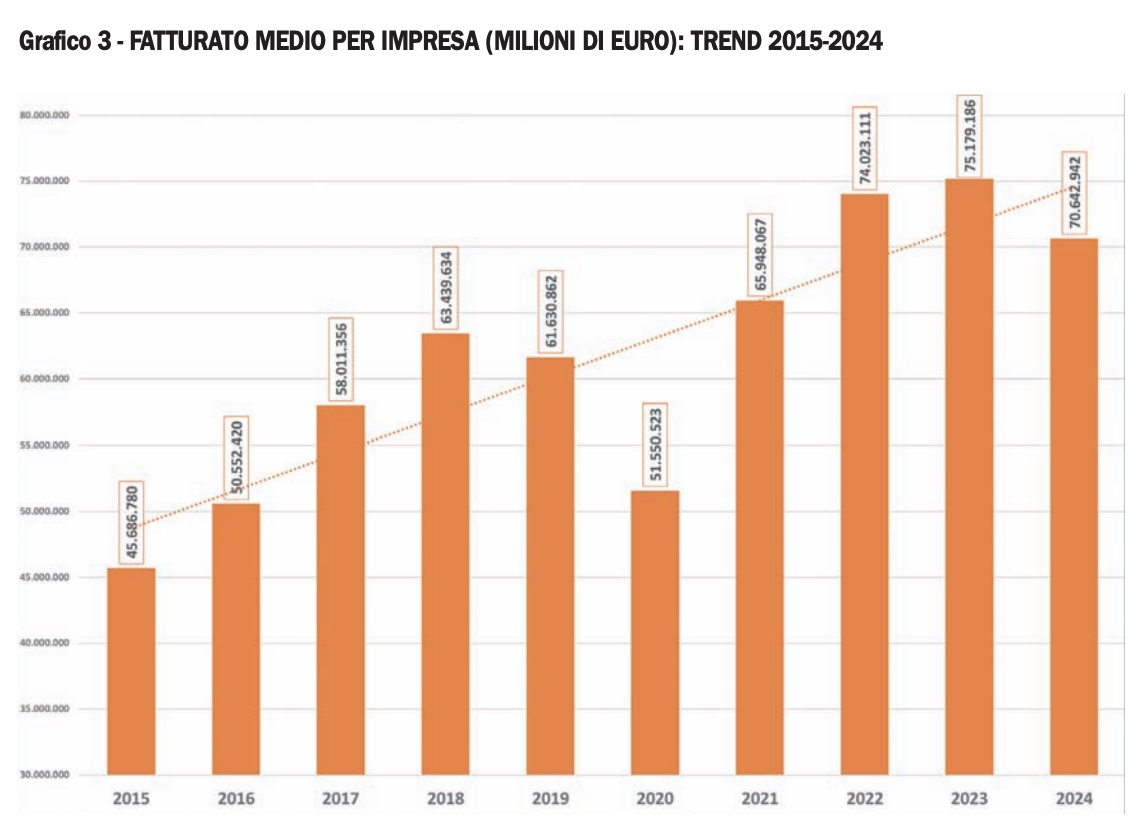
This market development has been both the cause and effect of a continuous consolidation process in company size in terms of revenue, rising from €45 million to more than €70 million today (Chart 3). This evolution is not merely the result of linear revenue growth, but reflects a broader phenomenon of competitive strengthening, which has included not only an expansion of production capacity but also integration operations and, in some cases, targeted acquisitions.
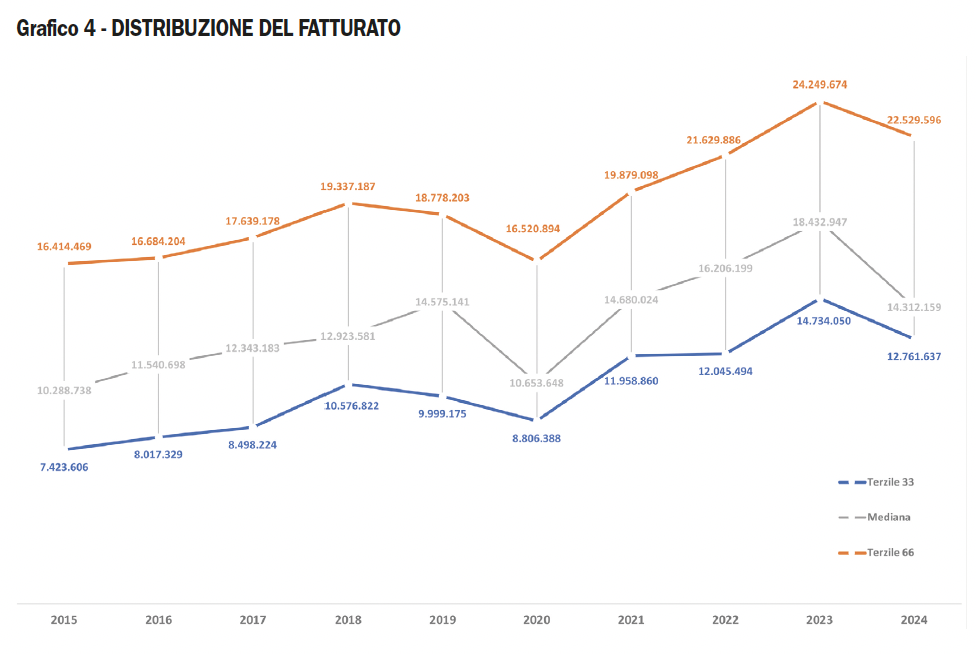
Analyzing the distribution by revenue classes (Chart 4), size consolidation appears as a widespread and systemic process: in fact, 90 percent of the companies in the sample recorded revenue growth during the period analyzed. This indicates that growth was not concentrated in just a few dominant players, but significantly involved the entire sample. However, a more detailed analysis by revenue class reveals some differences in growth dynamics.
Small companies showed a stronger-than-average propensity to grow. This phenomenon can be interpreted as the result of greater organizational flexibility, a leaner decision-making structure, and the ability to serve higher-potential market niches.
The largest companies also posted above-average growth performance. For these players, the size factor represents a decisive competitive advantage: greater investment capacity, economies of scale, bargaining power along the supply chain, the possibility of geographic and product diversification, and the ability to integrate or aggregate smaller companies.
By contrast, companies in the mid-sized segment showed more heterogeneous dynamics, to the point that the few companies that actually recorded a contraction in revenue belong mainly to this size range. This evidence suggests the existence of possible “competitive pressure” concentrated in this dimensional segment: too large to compete solely on flexibility and specialization, yet not sufficiently structured to fully benefit from the economies of scale and financial leverage typical of major market players.
EVOLUTION OF OPERATING PROFITABILITY
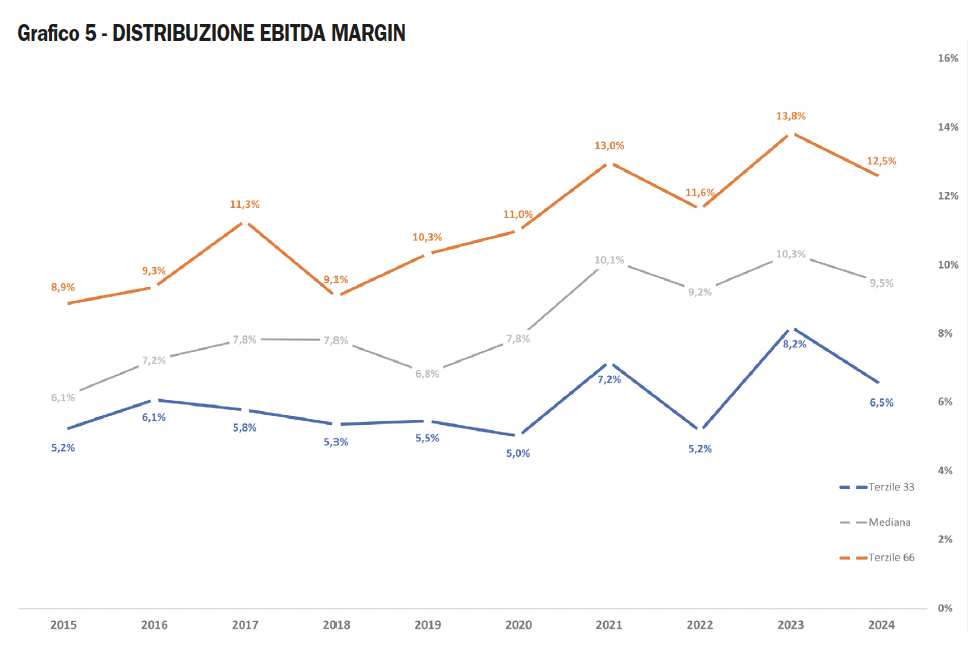
Alongside growth in company size, a second structural trend emerging from the long-term analysis concerns the recovery in operating profitability, which has been steady, signaling stronger managerial efficiency and a greater ability to generate value and cash flow through core business activities. The improvement in operating efficiency is particularly evident among small and large companies, which recorded increases of 3.9 and 2.6 percent respectively. Mid-sized companies, by contrast, showed more limited progress, with a change of roughly 1 percent compared with the levels of ten years ago.
From an earnings perspective as well, a polarization of performance emerges, consistent with what has been observed in terms of revenue growth.
The recovery in margins can be attributed to several factors: optimization of production processes, improved cost management, greater financial discipline, revision of pricing models, and an increase in the average value of products. In many cases, companies invested in digitalization and automation with the aim of increasing productivity and reducing operational inefficiencies. Although such investments implied a financial commitment, they contributed over the medium term to stronger margins. This gap shows that growth in company size did not automatically translate into increased profitability for all firms.
It should nevertheless be emphasized that the recovery in earnings was not as widespread a phenomenon as revenue growth. While 90 percent of companies saw their business volume increase, only 62 percent of the sample actually improved their EBITDA margin. This confirms that growth in company size does not automatically result in stronger profitability, but requires appropriate strategic and organizational choices (Chart 5).
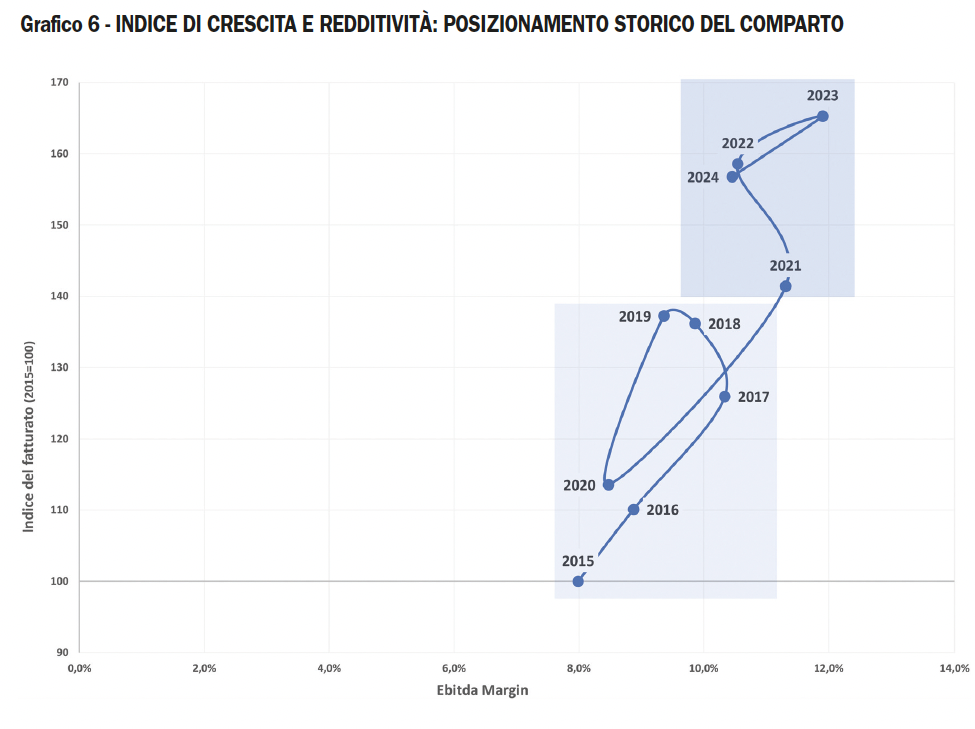
The integration of revenue dynamics and profitability dynamics makes it possible to identify two distinct phases over the decade: a first phase, extending from 2015 to the eve of the pandemic, characterized by a period of strong revenue growth accompanied by constant margin improvement. During this period—which we may consider to have ended in 2020, the year in which the sector experienced a “natural” crisis due to the effects of the Covid-19 pandemic—the sector benefited from an overall favorable macroeconomic environment and expanding demand.
The second phase begins with the discontinuity of 2021 and is represented by the post-pandemic rebound and the subsequent cycle of size growth and recovery of normal operating performance. After the contraction of 2020, the sector showed a significant capacity to recover.
However, this expansionary phase showed signs of progressive slowdown, up to the break recorded in 2024: rising cost pressure, macroeconomic uncertainty, and the normalization of demand all contributed to reducing the intensity of growth, bringing the sector back toward a more moderate trajectory, as shown in Chart 6, which cross-references EBITDA margin and the revenue index.
2025 AND THE CURRENT ECONOMIC PHASE
Overall, 2024 can therefore be interpreted as a year of cyclical normalization for the woodworking technology sector: despite a slight decline in volumes, the economic fundamentals remain solid and lay the groundwork for possible positive developments, particularly in relation to a recovery in investment in automation, technological innovation, and the sustainability of production processes.
Some additional remarks help frame the current business environment. The first concerns the other sectors monitored, which showed performance broadly in line with that of the machinery segment. In this scenario, the partial positive exception was the growth (up 1.2 percent) recorded by the sample of companies in the “Production of wood-based panels and semi-finished products” sector.
The second is a note on the sectors analyzed in their entirety and not only with reference to the largest companies. While the general trends are very similar, overall the largest companies almost always manage to outperform the average growth performance of their respective sectors.
In conclusion, the performance of the largest companies in 2024 reflects a mature industry, capable of navigating the uncertainties of the European macroeconomic landscape with a long-term vision. The substantial stability of margins and the resilience of employment provide the solid foundations on which to build a recovery, also driven by technological renewal and the opportunities linked to high-quality exports.
Table 1 – THE TOP 50 COMPANIES IN THE “WOODWORKING MACHINERY AND TOOLS” SECTOR
| Rank | Company | Revenue 2024 | Revenue 2023 | Change | Production value | EBITDA 2024 | EBITDA Margin | Profit/loss 2024 | Employees |
|---|---|---|---|---|---|---|---|---|---|
| 1 | Scm Group spa* | 841,278 | 914,078 | -8.0% | 851,243 | 91,361 | 10.9% | 21,697 | 4,121 |
| 2 | Biesse spa* | 754,698 | 785,002 | -3.9% | 760,808 | 57,659 | 7.6% | 3,750 | 3,972 |
| 3 | Cefla Società Cooperativa* | 666,381 | 684,923 | -2.7% | 674,958 | 85,677 | 12.9% | 69,516 | 1,815 |
| 4 | Freud spa | 161,300 | 149,985 | 7.5% | 164,692 | 25,101 | 15.6% | 8,942 | 653 |
| 5 | Pal srl | 106,602 | 107,556 | -0.9% | 95,869 | 10,833 | 10.2% | 7,200 | 184 |
| 6 | Cassioli srl | 99,636 | 81,631 | 22.1% | 120,387 | 22,489 | 22.6% | 16,399 | 413 |
| 7 | Imal srl | 83,964 | 74,441 | 12.8% | 79,787 | 7,954 | 9.5% | 2,299 | 231 |
| 8 | Costa Levigatrici spa | 43,599 | 48,966 | -11.0% | 44,595 | 5,389 | 12.4% | 3,343 | 195 |
| 9 | C.M.T. Utensili spa | 41,381 | 39,292 | 5.3% | 43,150 | 9,218 | 22.3% | 2,633 | 180 |
| 10 | Pezzolato spa | 35,546 | 34,686 | 2.5% | 34,684 | 4,312 | 12.1% | 1,967 | 125 |
| 11 | Paolino Bacci srl | 34,032 | 38,847 | -12.4% | 34,346 | 2,955 | 8.7% | 2,202 | 95 |
| 12 | Elmag spa | 30,029 | 26,259 | 14.4% | 30,387 | 4,343 | 14.5% | 3,272 | 71 |
| 13 | Storti spa | 29,709 | 33,880 | -12.3% | 34,894 | 3,179 | 10.7% | 1,861 | 147 |
| 14 | Uniconfort srl | 28,746 | 27,784 | 3.5% | 35,172 | 1,263 | 4.4% | 179 | 71 |
| 15 | Working Process srl | 28,013 | 28,192 | -0.6% | 29,663 | 4,890 | 17.5% | 2,983 | 87 |
| 16 | Homag Italia spa | 26,470 | 59,453 | -55.5% | 26,637 | 1,805 | 6.8% | 1,035 | 48 |
| 17 | Essetre srl | 23,860 | 23,227 | 2.7% | 23,850 | 5,234 | 21.9% | 3,542 | 56 |
| 18 | Coral spa | 21,844 | 23,846 | -8.4% | 23,054 | 1,488 | 6.8% | 101 | 116 |
| 19 | Makor srl | 20,581 | 23,932 | -14.0% | 21,905 | 1,858 | 9.0% | 1,005 | 108 |
| 20 | Giardinagroup srl | 19,455 | 17,439 | 11.6% | 19,918 | 1,044 | 5.4% | 348 | 62 |
| 21 | Corali spa | 18,276 | 20,050 | -8.8% | 20,043 | 3,611 | 19.8% | 2,812 | 68 |
| 22 | Masterwood spa | 18,234 | 24,865 | -26.7% | 17,127 | 364 | 2.0% | -237 | 97 |
| 23 | Imeas spa | 16,180 | 16,876 | -4.1% | 15,838 | 314 | 1.9% | 59 | 90 |
| 24 | Ormamacchine spa | 14,861 | 22,042 | -32.6% | 13,207 | 387 | 2.6% | 102 | 94 |
| 25 | Italpresse spa | 14,403 | 14,845 | -3.0% | 13,629 | 663 | 4.6% | 378 | 86 |
| 26 | Friulmac spa | 14,312 | 13,152 | 8.8% | 13,591 | 676 | 4.7% | 83 | 70 |
| 27 | Mion & Mosole spa | 14,231 | 18,865 | -24.6% | 14,563 | 441 | 3.1% | 3 | 83 |
| 28 | Angelo Cremona spa | 13,548 | 18,433 | -26.5% | 13,946 | 1,605 | 11.8% | 751 | 99 |
| 29 | Imas Aeromeccanica srl | 13,515 | 15,418 | -12.3% | 14,394 | 884 | 6.5% | 340 | 79 |
| 30 | Costruzioni Nazzareno srl | 13,328 | 16,461 | -19.0% | 13,786 | 2,209 | 16.6% | 1,500 | 32 |
| 31 | Manni srl | 13,257 | 12,234 | 8.4% | 12,650 | 1,063 | 8.0% | 89 | 71 |
| 32 | Co.Im.A. srl | 13,231 | 14,709 | -10.1% | 13,409 | 2,225 | 16.8% | 1,073 | 48 |
| 33 | Primultini srl | 12,921 | 19,623 | -34.2% | 13,122 | 291 | 2.3% | 105 | 50 |
| 34 | Centauro spa | 12,729 | 16,355 | -22.2% | 13,216 | 746 | 5.9% | -73 | 77 |
| 35 | Comec Group srl | 12,182 | 12,041 | 1.2% | 12,749 | 1,849 | 15.2% | 1,278 | 54 |
| 36 | Globus srl | 11,887 | 15,601 | -23.8% | 13,432 | 1,872 | 15.7% | 956 | 57 |
| 37 | Stemas srl | 11,763 | 6,392 | 84.0% | 15,487 | 321 | 2.7% | 37 | 45 |
| 38 | Omal srl | 11,601 | 8,930 | 29.9% | 10,827 | 2,100 | 18.1% | 1,033 | 32 |
| 39 | Stema srl | 10,915 | 14,711 | -25.8% | 11,999 | 477 | 4.4% | 72 | 50 |
| 40 | Dalso srl | 10,815 | 13,842 | -21.9% | 12,349 | 1,036 | 9.6% | 332 | 39 |
| 41 | Finiture srl | 10,363 | 12,822 | -19.2% | 10,192 | 1,523 | 14.7% | 991 | 37 |
| 42 | E.M.C. srl | 10,178 | 11,356 | -10.4% | 10,562 | 426 | 4.2% | 265 | 39 |
| 43 | Sirio srl | 10,050 | 22,088 | -54.5% | 10,747 | 986 | 9.8% | 1,147 | 35 |
| 44 | Arco International srl | 10,009 | 10,513 | -4.8% | 10,063 | 448 | 4.5% | 66 | 19 |
| 45 | Saomad 2 srl | 9,908 | 9,268 | 6.9% | 11,178 | 3,149 | 31.8% | 2,261 | 31 |
| 46 | Ima Schelling Italia srl | 9,669 | 8,033 | 20.4% | 10,623 | 1,670 | 17.3% | 1,025 | 24 |
| 47 | Leitz Italia srl | 9,652 | 10,610 | -9.0% | 9,643 | 175 | 1.8% | -387 | 58 |
| 48 | Berizzi srl | 9,487 | 9,205 | 3.1% | 9,768 | 616 | 6.5% | 110 | 34 |
| 49 | Vitap spa | 9,364 | 13,373 | -30.0% | 10,563 | 483 | 5.2% | 114 | 47 |
| 50 | Twt srl | 9,355 | 9,220 | 1.5% | 9,444 | 1,239 | 13.2% | 680 | 53 |
* consolidated financial statements
Note: The ranking also includes companies characterized by mixed production activities, for which it is obviously impossible to determine the percentage attributable to the “wood technologies” sector on the basis of financial statement data alone.
Table 2 – THE TOP 20 COMPANIES IN THE “WOOD FURNITURE PRODUCTION” SECTOR
| Rank | Company | Revenue 2024 | Revenue change | EBITDA 2024 | EBITDA Margin | Profit/loss for the year 2024 | Employees |
|---|---|---|---|---|---|---|---|
| 1 | Friul Intagli Industries spa | 900,487 | 4.0% | 153,086 | 17.0% | 89,485 | 2,297 |
| 2 | Molteni & C. spa | 350,921 | 10.0% | 32,209 | 9.2% | 18,182 | 717 |
| 3 | Veneta Cucine spa | 293,804 | 4.2% | 34,458 | 11.7% | 16,384 | 545 |
| 4 | Lube Industries srl | 276,075 | 0.6% | 28,718 | 10.4% | 19,712 | 521 |
| 5 | Natuzzi spa | 253,818 | -5.3% | 3,258 | 1.3% | -15,254 | 1,829 |
| 6 | Arredo 3 srl | 253,483 | 7.3% | 24,698 | 9.7% | 14,070 | 318 |
| 7 | Poliform spa | 238,990 | -6.4% | 41,169 | 17.2% | 22,556 | 708 |
| 8 | 3 B – spa | 218,343 | 11.0% | 15,423 | 7.1% | 2,914 | 732 |
| 9 | Minotti spa | 202,478 | -8.1% | 58,343 | 28.8% | 45,509 | 240 |
| 10 | Poltrona Frau spa | 201,287 | -8.1% | 30,454 | 15.1% | 13,540 | 753 |
| 11 | Scavolini spa | 200,569 | -3.1% | 12,908 | 6.4% | 4,461 | 578 |
| 12 | Stosa spa | 182,372 | 0.8% | 22,519 | 12.3% | 11,680 | 291 |
| 13 | Marinelli Cucine srl | 180,931 | -4.8% | 5,699 | 3.1% | 2,004 | 253 |
| 14 | Imab Group spa | 163,784 | -1.4% | 5,671 | 3.5% | -1,469 | 637 |
| 15 | Cassina spa | 150,578 | -2.5% | 24,635 | 16.4% | 12,259 | 326 |
| 16 | Gruppo Turi srl | 144,878 | -15.5% | 1,176 | 0.8% | -3,555 | 236 |
| 17 | Marinelli Prefabbricati srl | 139,937 | -4.6% | 3,277 | 2.3% | 795 | 98 |
| 18 | Ilcam spa | 134,296 | -5.5% | 4,145 | 3.1% | 3,912 | 449 |
| 19 | F A B srl | 122,358 | -7.3% | 15,832 | 12.9% | 5,918 | 474 |
| 20 | Atl Group spa | 120,640 | -3.9% | 7,136 | 5.9% | 3,745 | 544 |
Table 3 – THE TOP 20 COMPANIES IN THE “PRODUCTION OF WOOD-BASED PANELS AND SEMI-FINISHED PRODUCTS” SECTOR
| Rank | Company | Revenue 2024 | Revenue change | EBITDA 2024 | EBITDA Margin | Profit/loss for the year 2024 | Employees |
|---|---|---|---|---|---|---|---|
| 1 | Media Profili srl | 417,115 | 9.4% | 28,159 | 6.8% | 8,813 | 1,082 |
| 2 | Gruppo Mauro Saviola srl | 316,499 | -5.7% | 38,726 | 12.2% | 21,894 | 690 |
| 3 | Fantoni spa | 270,337 | -8.3% | 33,151 | 12.3% | 8,049 | 587 |
| 4 | Frati Luigi spa | 190,294 | -6.3% | 24,091 | 12.7% | 13,000 | 328 |
| 5 | Egger Italia spa | 170,898 | 175.6% | 20,581 | 12.0% | 6,887 | 249 |
| 6 | Cleaf spa | 154,774 | 6.2% | 26,568 | 17.2% | 15,884 | 304 |
| 7 | Kronospan Italia srl | 101,382 | -11.9% | 5,304 | 5.2% | 513 | 88 |
| 8 | Bipan spa | 97,018 | -1.6% | 9,909 | 10.2% | 1,041 | 211 |
| 9 | Kastamonu Italia spa | 92,194 | -7.7% | 12,893 | 14.0% | -8,098 | 295 |
| 10 | Panguaneta spa | 91,999 | -12.0% | 15,716 | 17.1% | 8,705 | 198 |
| 11 | Alpi spa | 82,886 | -12.8% | 14,481 | 17.5% | 7,109 | 467 |
| 12 | Invernizzi spa | 51,224 | -20.6% | 4,621 | 9.0% | 618 | 159 |
| 13 | San Giorgio spa | 41,517 | 11.5% | 7,209 | 17.4% | 4,241 | 59 |
| 14 | E. Vigolungo spa | 39,805 | -6.5% | 2,635 | 6.6% | 132 | 170 |
| 15 | Topstar spa | 35,364 | -9.4% | 4,021 | 11.4% | 1,937 | 128 |
| 16 | Tabu spa | 34,933 | -8.4% | 3,105 | 8.9% | 1,210 | 176 |
| 17 | X-Lam Dolomiti spa | 34,379 | 17.3% | 3,259 | 9.5% | 1,831 | 84 |
| 18 | Nobilpan spa | 33,952 | -25.6% | 4,838 | 14.3% | 2,576 | 36 |
| 19 | C.I.M.A. srl | 28,187 | 0.9% | 1,764 | 6.3% | 38 | 96 |
| 20 | Sm’art srl | 26,272 | 9.2% | 3,423 | 13.0% | 1,606 | 41 |
Table 4 – THE TOP 20 COMPANIES IN THE “PRODUCTION OF WOODEN WINDOWS AND DOORS” SECTOR
| Rank | Company | Revenue 2024 | Revenue change | EBITDA 2024 | EBITDA Margin | Profit/loss for the year 2024 | Employees |
|---|---|---|---|---|---|---|---|
| 1 | Bertolotto spa | 63,419 | 15.0% | 8,788 | 13.9% | 3,045 | 200 |
| 2 | Cocif Società Cooperativa | 44,864 | -33.4% | 4,915 | 11.0% | 32 | 209 |
| 3 | Garofoli spa | 42,107 | 1.9% | 4,536 | 10.8% | 2,015 | 213 |
| 4 | Zanini spa | 38,982 | 9.7% | 2,750 | 7.1% | 1,265 | 67 |
| 5 | Palagina srl | 33,546 | 0.0% | 5,298 | 15.8% | 2,723 | 202 |
| 6 | Finvest Group srl | 30,754 | 12.0% | 4,297 | 14.0% | 2,967 | 4 |
| 7 | Effebiquattro spa | 30,682 | 0.5% | 1,766 | 5.8% | 283 | 80 |
| 8 | Silvelox Group spa | 28,796 | 0.9% | 2,493 | 8.7% | -72 | 127 |
| 9 | Rubner Tueren srl | 28,285 | -6.1% | 2,759 | 9.8% | 1,863 | 181 |
| 10 | G.D. Dorigo spa | 27,747 | 0.9% | 2,679 | 9.7% | 1,301 | 115 |
| 11 | Lualdi spa | 26,890 | 41.1% | 2,773 | 10.3% | 741 | 120 |
| 12 | Capoferri Serramenti spa | 26,261 | 42.2% | 3,906 | 14.9% | 1,018 | 105 |
| 13 | Tip Top Fenster Gmbh | 25,568 | -5.9% | 2,382 | 9.3% | 1,131 | 125 |
| 14 | Ferrerolegno spa | 24,711 | 7.0% | 2,597 | 10.5% | 1,093 | 96 |
| 15 | Gidea srl | 24,245 | -2.6% | 1,358 | 5.6% | 1,204 | 96 |
| 16 | Pail Serramenti srl | 22,552 | -0.8% | 2,217 | 9.8% | 974 | 115 |
| 17 | Flessya srl | 20,639 | 1.0% | 1,987 | 9.6% | 923 | 72 |
| 18 | Saba srl | 18,785 | -9.5% | 1,733 | 9.2% | 182 | 75 |
| 19 | Barausse srl | 18,252 | 17.5% | 3,870 | 21.2% | 2,533 | 82 |
| 20 | Italserramenti srl | 18,133 | -34.0% | 2,165 | 11.9% | 274 | 114 |
Table 5 – THE TOP 10 COMPANIES IN THE “WOODEN HOUSES AND BUILDING COMPONENTS” SECTOR
| Rank | Company | Revenue 2024 | Revenue change | EBITDA 2024 | EBITDA Margin | Profit/loss for the year 2024 | Employees |
|---|---|---|---|---|---|---|---|
| 1 | Braga spa | 108,851 | 4.1% | 15,551 | 14.3% | 7,760 | 271 |
| 2 | Rubner Haus srl | 58,624 | 3.8% | 1,586 | 2.7% | 135 | 198 |
| 3 | Margaritelli spa | 53,863 | -8.0% | 5,802 | 10.8% | -3,360 | 259 |
| 4 | Della Camera Arredamenti srl | 37,157 | 2.2% | 5,057 | 13.6% | 2,838 | 121 |
| 5 | Skema spa | 31,395 | -1.9% | 3,456 | 11.0% | 1,614 | 54 |
| 6 | Bgp Group srl | 31,151 | 6.1% | 5,433 | 17.4% | 3,556 | 34 |
| 7 | Bio Habitat Italia srl | 29,077 | -16.8% | 3,944 | 13.6% | 2,020 | 98 |
| 8 | Transpack Group Service spa | 26,129 | 6.0% | 2,663 | 10.2% | 703 | 48 |
| 9 | Stairs Studio spa | 19,792 | 9.1% | 980 | 5.0% | 421 | 73 |
| 10 | Parchettificio Garbelotto srl | 18,553 | 9.9% | 3,491 | 18.8% | 1,827 | 53 |
| 11 | Cp Parquet srl | 16,290 | 1.4% | 1,134 | 7.0% | 580 | 67 |
| 12 | Itlas srl Società Benefit | 16,021 | -4.8% | 1,596 | 10.0% | 731 | 39 |
| 13 | Gizia srl | 14,695 | 3.0% | 978 | 6.7% | 463 | 37 |
| 14 | Galimberti srl | 14,427 | 4.1% | 1,906 | 13.2% | 990 | 55 |
| 15 | I.L.M.A. srl | 13,947 | -30.5% | 986 | 7.1% | -729 | 41 |
| 16 | Erlacher srl | 13,260 | -20.7% | 1,978 | 14.9% | 1,250 | 52 |
| 17 | Unikolegno.It srl | 12,209 | 61.4% | 902 | 7.4% | 460 | 28 |
| 18 | Stp srl | 11,621 | -20.4% | 2,139 | 18.4% | 1,461 | 30 |
| 19 | Tecnopal srl | 11,539 | -11.0% | 3,777 | 32.7% | 2,213 | 30 |
| 20 | Legnotech spa | 11,373 | -10.1% | 1,196 | 10.5% | 599 | 39 |
Table 6 – THE TOP 20 COMPANIES IN THE “WOOD AND FURNITURE: COMMERCIALIZATION” SECTOR
| Rank | Company | Revenue 2024 | Revenue change | EBITDA 2024 | EBITDA Margin | Profit/loss for the year 2024 | Employees |
|---|---|---|---|---|---|---|---|
| 1 | Corà Domenico & Figli spa | 84,006 | -13.9% | 5,525 | 6.6% | 1,711 | 83 |
| 2 | L.E.S. srl | 65,848 | -3.8% | 5,614 | 8.5% | 4,052 | 8 |
| 3 | Adriacoke Commodities srl | 51,345 | -11.9% | 4,227 | 8.2% | 20,836 | 10 |
| 4 | Kimono spa | 47,443 | 10.2% | 2,824 | 6.0% | 864 | 34 |
| 5 | Sangiorgi Legnami spa | 46,795 | -11.5% | 6,072 | 13.0% | 3,497 | 31 |
| 6 | Gbp Holding srl | 43,510 | -3.8% | 3,261 | 7.5% | 2,253 | 50 |
| 7 | Buffoli Legnami srl | 42,410 | 3.4% | 2,427 | 5.7% | 1,013 | 12 |
| 8 | Karl Pichler spa | 41,089 | 1.2% | 6,063 | 14.8% | 3,152 | 67 |
| 9 | Lp Group srl | 38,064 | 7.8% | 3,356 | 8.8% | 1,759 | 15 |
| 10 | Imola Legno spa | 38,040 | -6.9% | 499 | 1.3% | -1,551 | 96 |
| 11 | Flo.It srl | 36,196 | -9.4% | 3,362 | 9.3% | 1,512 | 58 |
| 12 | The Italian Decking Comp. spa | 35,860 | 11.8% | 8,538 | 23.8% | 1,127 | 31 |
| 13 | Paganoni Importlegno spa | 31,545 | -9.5% | 1,260 | 4.0% | 272 | 16 |
| 14 | I.C.M. Ind. Comp. Moglia spa | 29,072 | 5.6% | 1,666 | 5.7% | 389 | 15 |
| 15 | Frezza Legnami spa | 28,814 | 11.0% | 2,338 | 8.1% | 29 | 30 |
| 16 | Gruppo Sigel Italia srl Sb | 27,762 | -6.1% | 1,515 | 5.5% | 319 | 55 |
| 17 | Magazzini Bracchi srl | 26,481 | 9.8% | 1,936 | 7.3% | 713 | 100 |
| 18 | Schifino Legnami spa | 24,329 | 4.5% | 1,088 | 4.5% | 318 | 26 |
| 19 | Guercio spa | 24,118 | -10.0% | 732 | 3.0% | 31 | 112 |
| 20 | Timtrade srl | 22,862 | 20.5% | 951 | 4.2% | 691 | 6 |
Read also...
SCM at Xylexpo 2026: technology, software and digital services
Egger: lo stabilimento di Unterradlberg “teleriscalderà” la città di St. Pölten

FederlegnoArredo: the floor to Carlo Piemonte
From the open-house event to Xylexpo 2026: SCM Group bets on innovation
Ima Schelling: “The old recipes no longer work”